
Conservation of Arctic Flora and Fauna
CAFF is the Biodiversity Working Group of the Arctic Council.
Topics
Latest news

In memory of Dr. Igor A. Melnikov
Dr. Igor A Melnikov: 13/11/39-17/09/232024-03-12

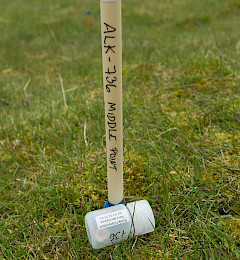
Nordic Coastal Monitoring Workshop Report Released
Nordic Coastal Monitoring Workshop Report Released2024-01-02

New CAFF Executive Secretary: welcome to Dr. Fiona S. Danks!
Dr. Fiona S. Danks will join the CAFF International Secretariat in Akureyri, Iceland in February 2024.2023-12-13